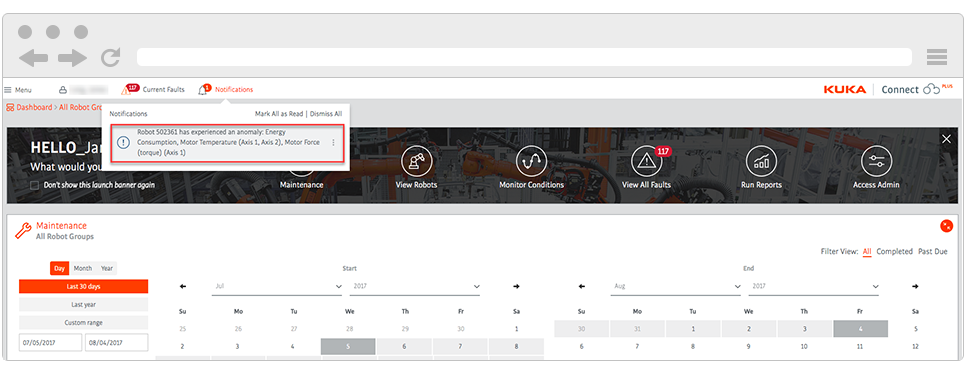
Imagine that you can tell for sure and in advance that some robot will fail, and that you can prevent the “abrupt” stoppage of the entire manufacturing line. Awesome!
The Aberrations detection system will only be available for the KUKA robots that have subscribed for KUKA Connect Plus.

On the “Robot Details” card -> “Condition Monitoring” tab, you can find the graphs that show deviations in the ratio of temperature, current and motor torque (force). The Aberrations detection system is designed to be continuously examining the normal ranges of robots’ motor variables, detect recurring deviations from these norms, and notify engineer once deviations occur. The Aberrations detection system works as an early warning system, so that the manufacturer can be on guard and avoid eventual outages.
Let’s see how to find out aberrations!
Once the Aberrations detection system detects deviations in the robotic process, it sends you a notification thereof. To view notification details, you should select the notification icon and then select this notification in the drop-down.
NOTE. The “Aberration event” is viewed as a repeated set of deviations that has been occurring for several days.

You will get to the Robot details card and see the Aberration menu. Select the “Monitor Condition” icon to see the Robot’s deviations graph.
Viewing Aberration event in the Robot details card
In the graph section, select a reported variable of the motor and its statistics (for example, common deviation, average value).
The motor’s graphs in the robot’s card display both hourly and daily statistics, and are updated every 10 minutes.
The variables of the graphs include:
Motor temperature: a linear graph of the minimum, average, average, average or standard engine temperature deviation on the axis (for example Axis 1, Axis 2).
Motor current: a linear graph of the minimum, average, maximum, average or standard deviation of the motor current on the axis (for example, Axis 1, Axis 2).
Motor force (torque): A linear graph of the minimum, average, average, average, or standard deviations on the axis (for example, Axis, Axis 2).
The linear graphs display the robot’s behaviour in the selected time range as follows:
Orange points: the value is in the normal operating range.
Red points: the value exceeds the upper limit of the normal operating range.
Blue points: the value is below the lower limit of the normal operating range.
